
Did you know that the United States spends over $4 trillion annually on healthcare? Unfortunately, between 3% and 10% of this spending is lost to abuse, waste, and fraud. As I researched healthcare claims data, I discovered the staggering amount spent on prescription drug claims each year. There is a crisis of drug abuse and fraud, particularly with labeled drugs such as opioids, antibiotics, long-acting opioids, and antipsychotics for the elderly. This is a serious issue that not only hurts the health and well-being of individuals and society but also leads to higher costs for care and exorbitant financial losses for individuals and organizations.
When our aim is to identify suspicious claims, we face a problem: there is an overwhelming amount of healthcare data. It’s like finding a needle in a haystack. What we can do is to conduct claim segmentation and then identify suspicious claims. This way, we reduce the size of the search pool, cluster similar claims into groups, and make the anomaly detection task easier.
Where can we get the data? The actual patient claim data is protected and not available to the public. However, the Centers for Medicare and Medicaid Services (CMS) provide aggregated claim data at the provider level. This data contains information on prescription drugs provided to Medicare beneficiaries by providers, as well as the demographics of the providers. In this case, I will use the Medicare Part D claim dataset.
Exploratory Data Analysis
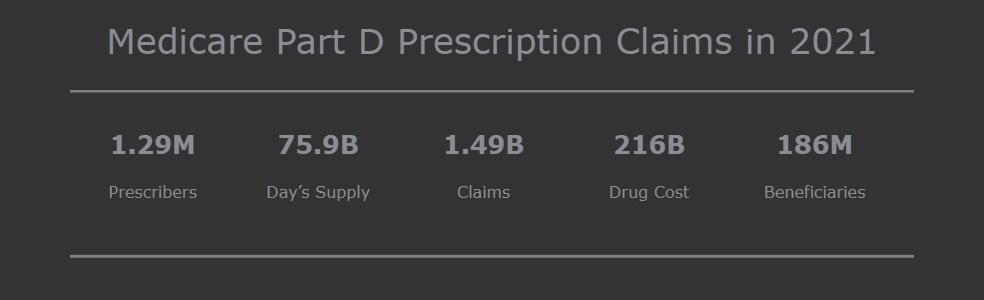
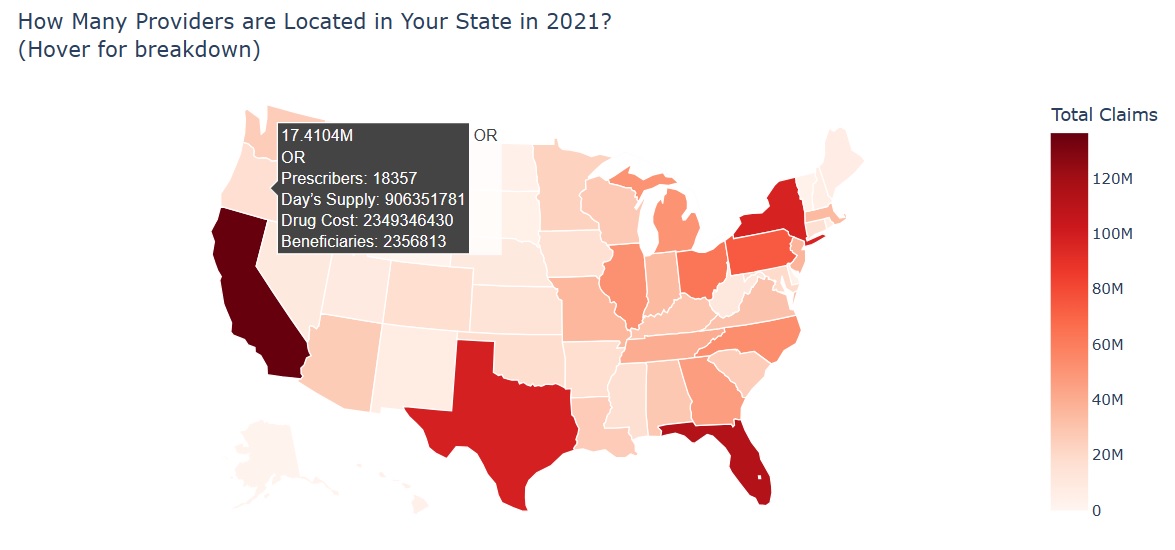
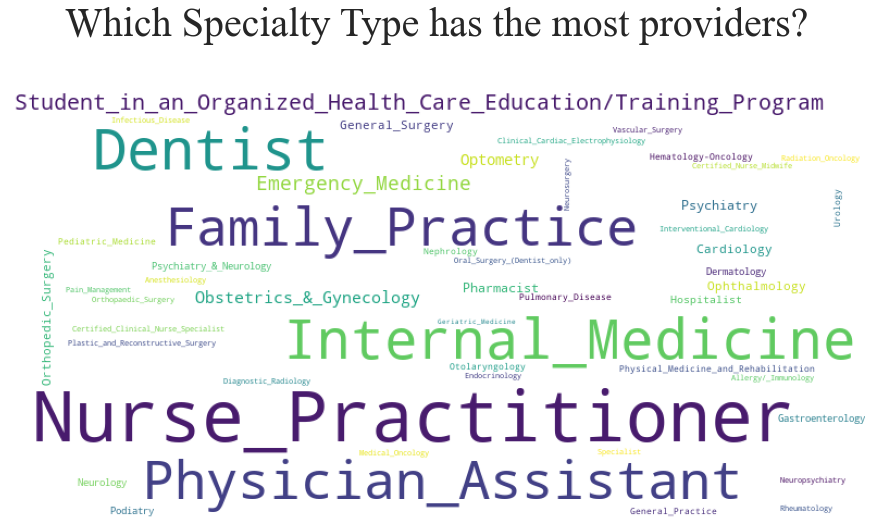
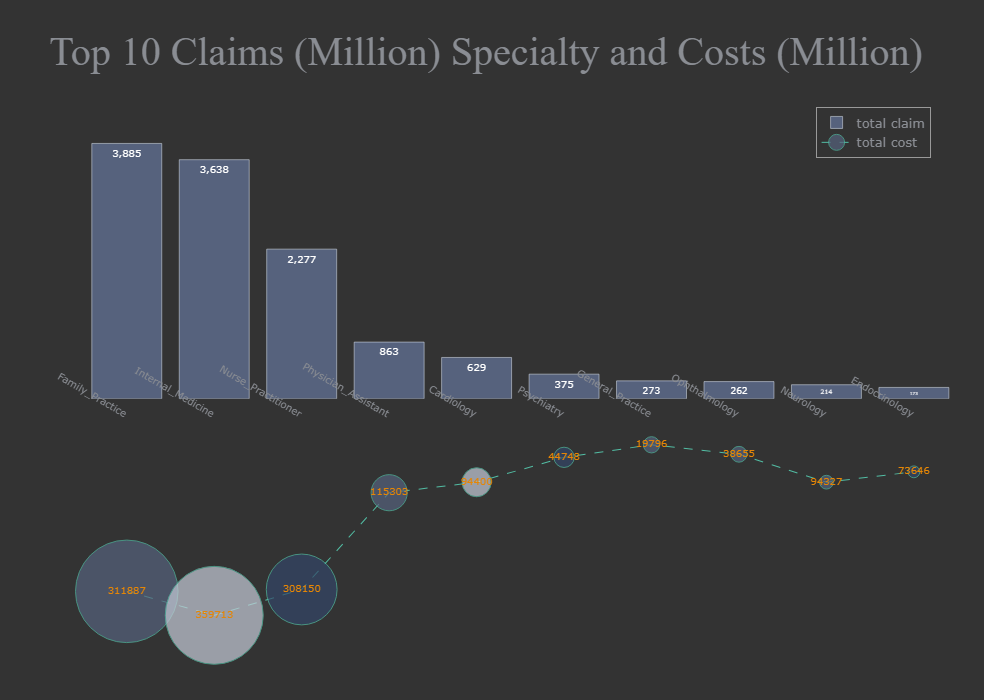
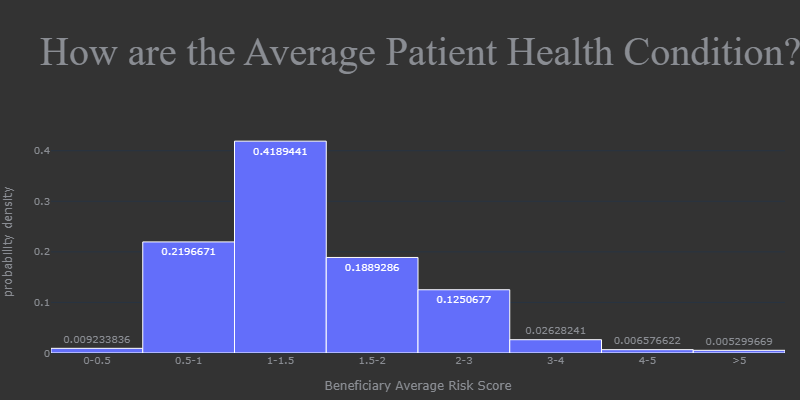
Here is an overview of overall Medicare Part D Prescibers scenario in the US. We can see the number of providers in each state in 2021, and the claims percentage by drug label, brand, insurance plan, and subsidy. We can also easily identify the specialty with the most providers, claims, and costs. In addition, we have a histogram to show us the average health condition of bentificiaries.
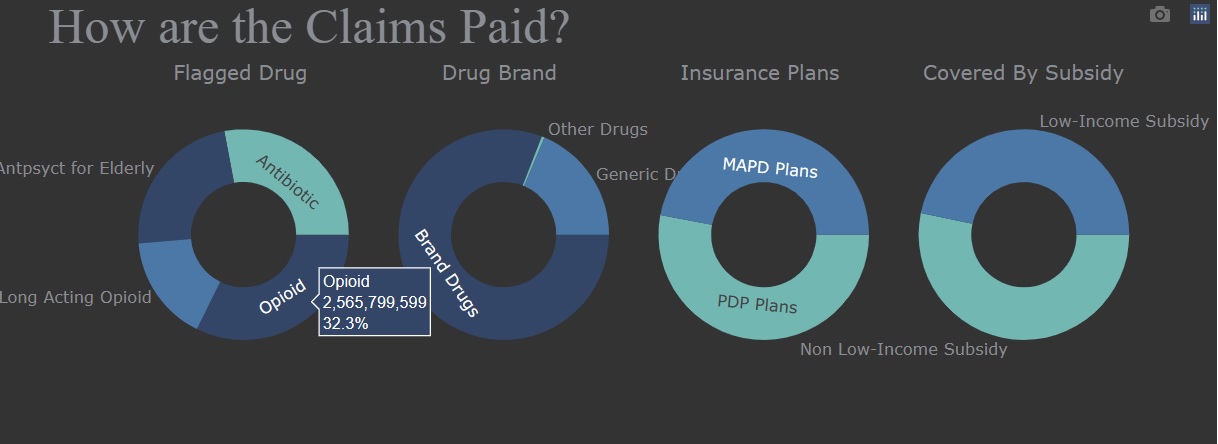
During the exploratory data analysis section, I found that four labeled drugs - opioids, antibiotics, long-acting opioids, and antipsychotics for the elderly - accounted for 3.69% of the total drug cost. Therefore, when it comes to detecting fraudulent behavior by prescribers for labeled drugs, I selected related features to avoid interference from irrelevant information.
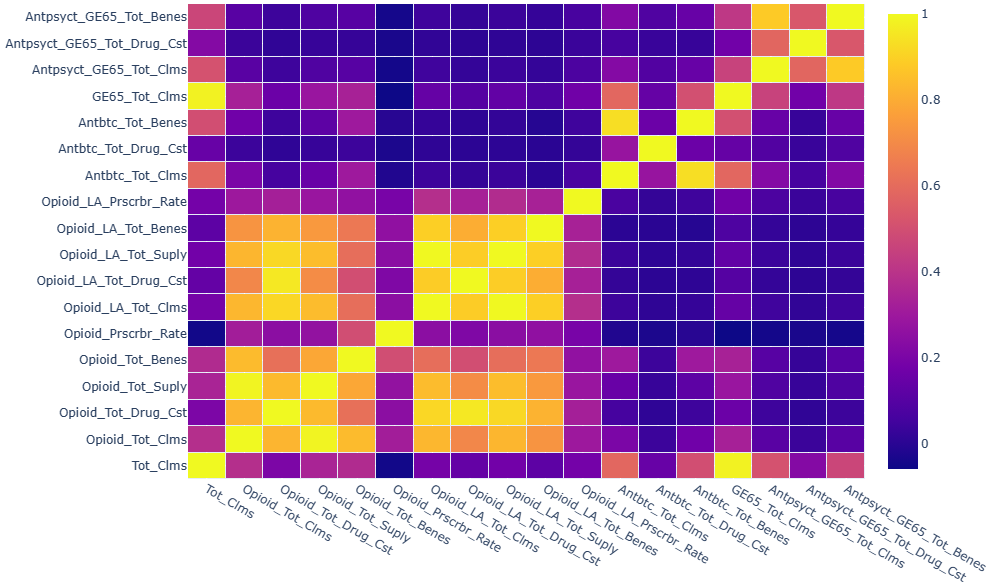
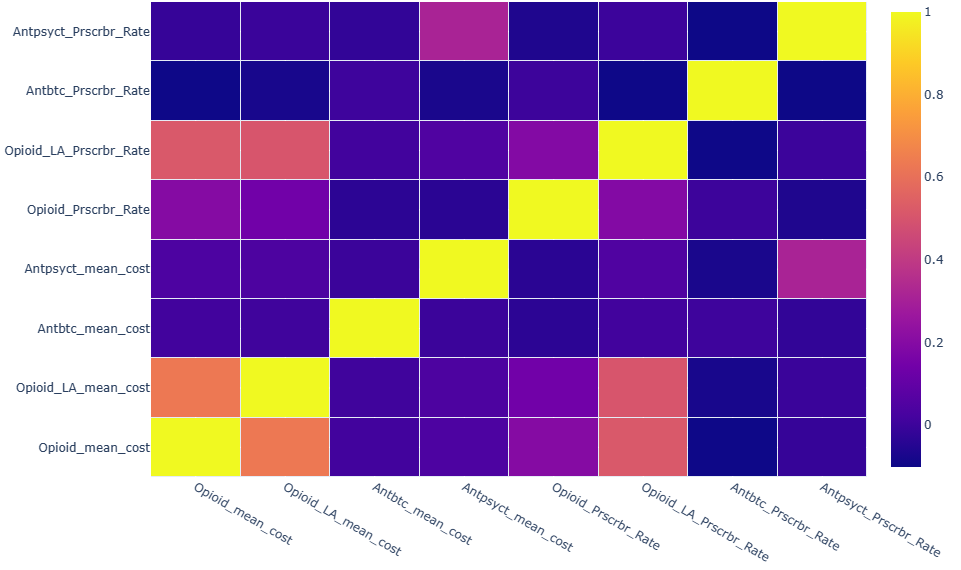
Wow, some features had high positive correlation. After some study, I decide to use mean cost, and prescriber rate as key metrics. Now, there were no high correlated features.
Claims Segmentation
I applied k-means clustering to partition claim data into k clusters in which each observation belonged to the cluster with the nearest centroid, and used KElbowVisualizer to identify optimum number of clusters. As shown in below, I decided that 6 is the optimum number of clusters.
from yellowbrick.cluster import KElbowVisualizer
from sklearn.cluster import KMeans
print('Elbow Method to determine the number of clusters:')
plt.figure(figsize=(10,5))
Elbow_M = KElbowVisualizer(KMeans(), k=10)
Elbow_M.fit(df_scaled)
Elbow_M.show()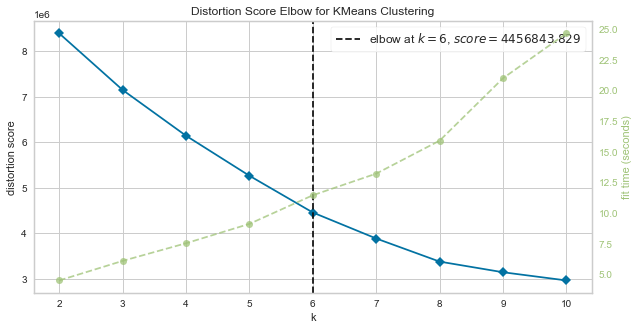
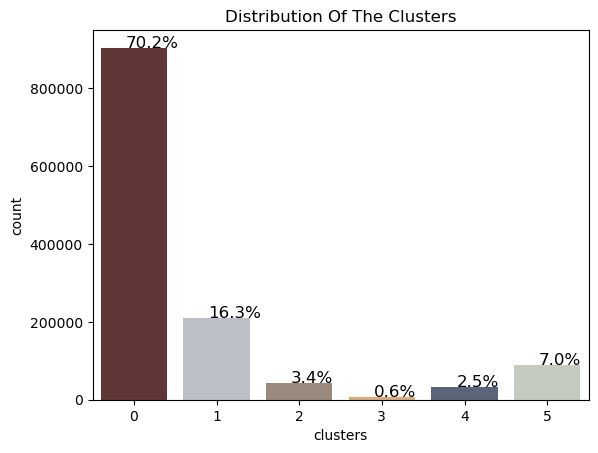
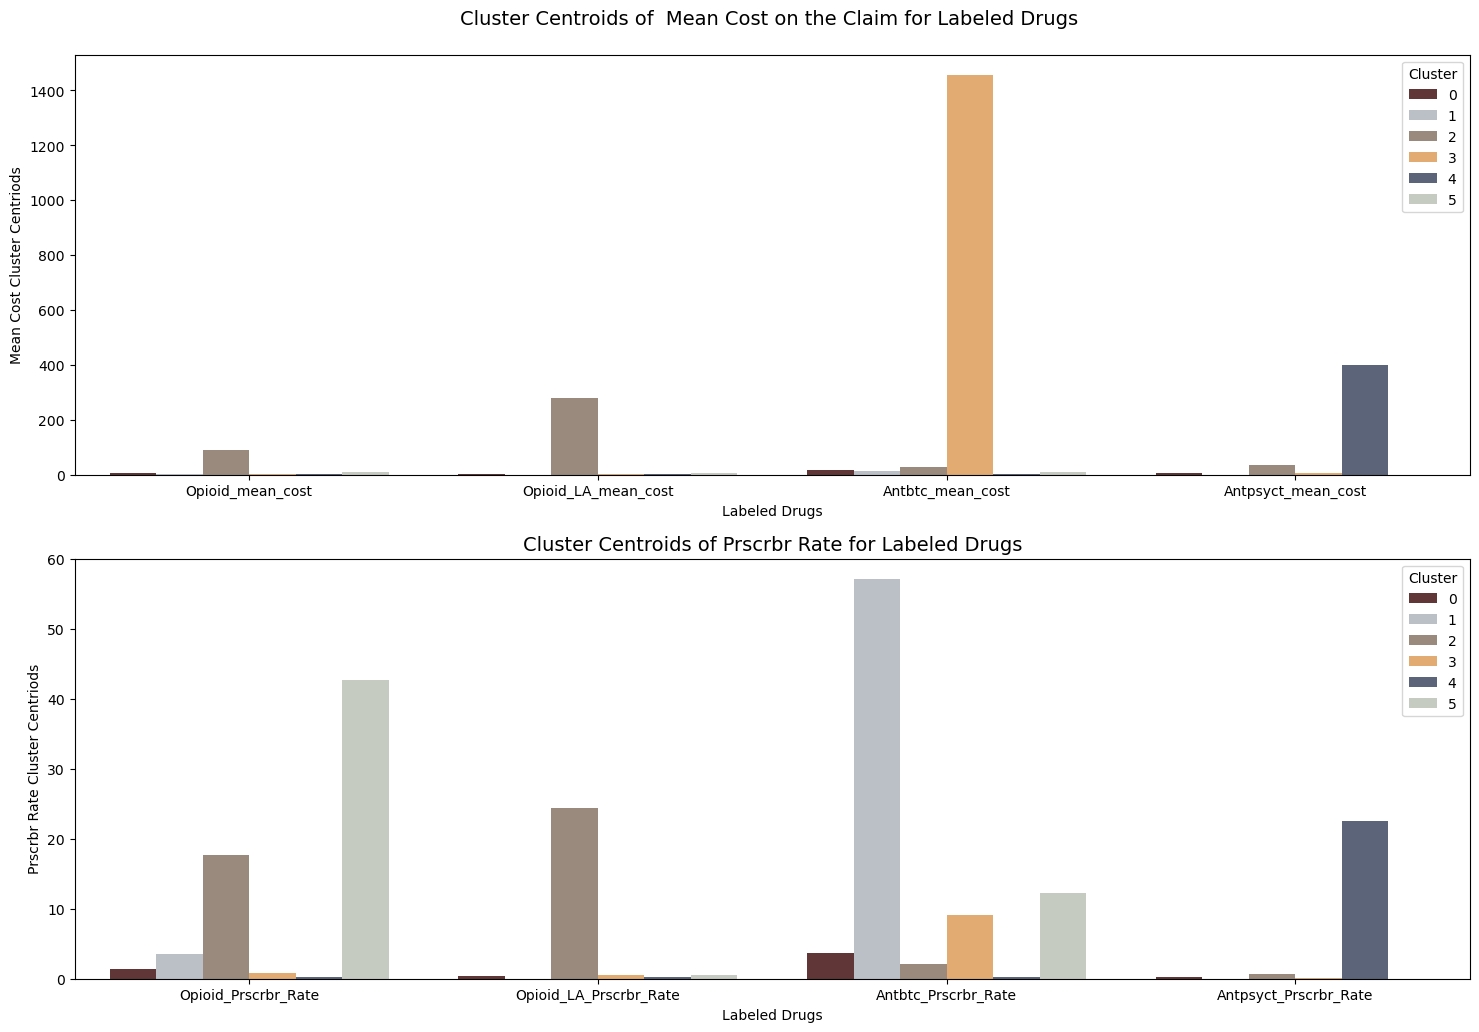
The details of six clusters and key metrics’ centriods for each cluster were shown in below.
I conducted some descriptive statistics analysis for key metrics. By analyzing those statistics information with boxplot, I identify some patterns for each cluster.
for i in range(df_clean.shape[1]):
    print ("\n" + df_clean.columns[i] + "describled by clusters \n")
    for  j in range(0,6,1):
        print ("Cluster:", str(j))
        print(df_clean.iloc[:,i][df_clean['clusters']==j].describe())
for name in df_clean.columns[:-1]:
sns.set(rc={"figure.figsize":(8, 4)})
sns.boxplot(x="clusters",y=name, data=df_clean).set_title(name + " vs. Clusters")
plt.show()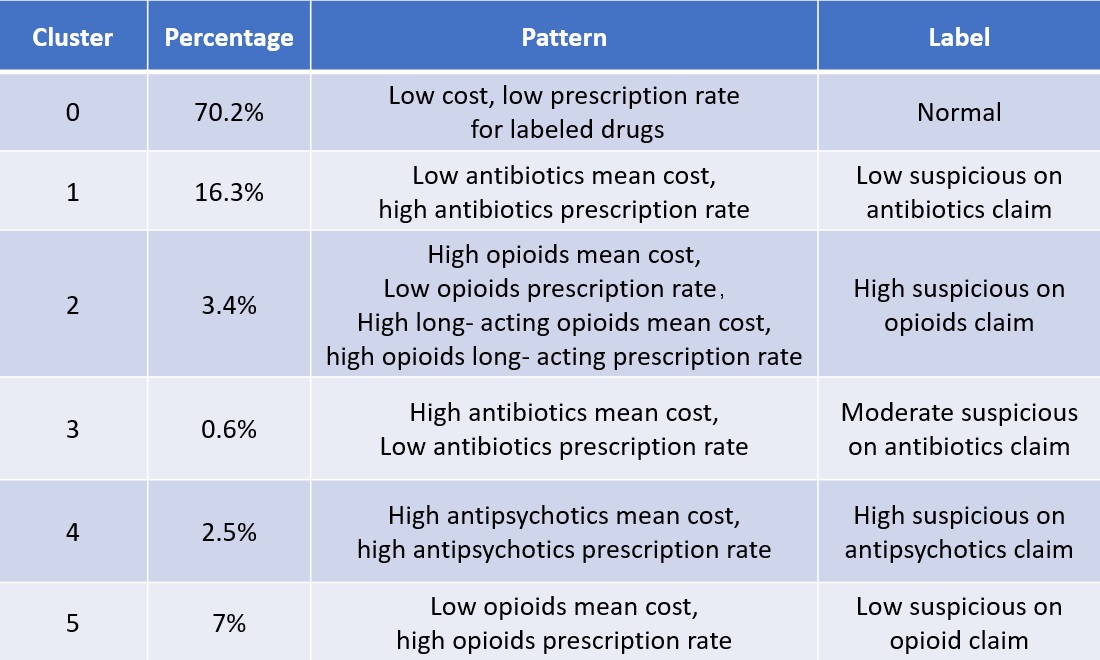
Suspicious claims of labeled drugs can be narrowed down to specific clusters: Claims with high mean cost and low prescription rate for opioids, as well as high mean cost and high prescription rate for long-acting opioids, were grouped into the second cluster. Claims with high mean cost and low prescription rate for antibiotics were grouped into the third cluster. Claims with high mean cost and high prescription rate for antipsychotics were grouped into the fourth cluster. By narrowing the scope of our search, we can identify fraudulent prescribers from highly suspicious clusters more quickly and precisely.
As we know, the mean cost and prescription rate for specific drugs are incomparable among specialty types. Therefore, when diagnosing if a provider offers suspicious claims, we need to compare them within the same specialty type. In the instance below, let’s see if labeled drug claims from a specific specialty type in a suspicious cluster are significantly different from others. Firstly, we list the specialty types in the second cluster, which was labeled as high suspicious on Opioid claims, and pick up a specialty type that we are interested in - here, I choose family practice as an example - and then compare the key metrics among clusters.
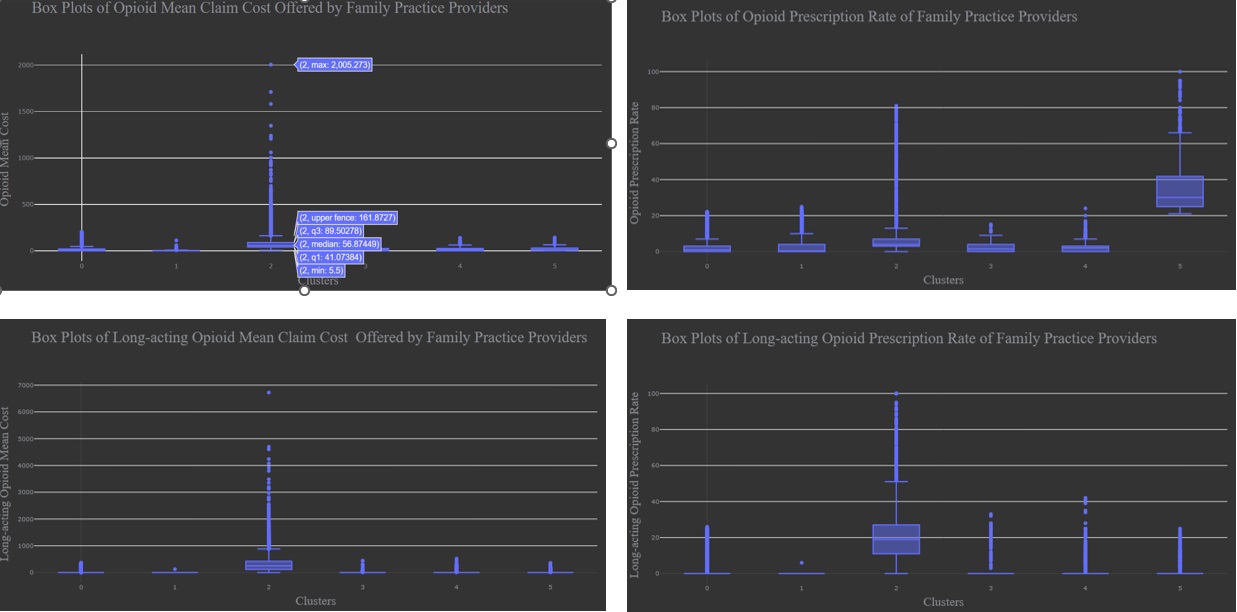
According to statistical description of data and boxplot, we confirmed that Claims in Clusters 2 were significant different from those in other clusters and also high suspicious on the opioid claims.
Anomaly Detection
Finally, we will demonstrate how to detect anomalous claims from a specified specialty.
Mothed 1: direct method using scatter plot.
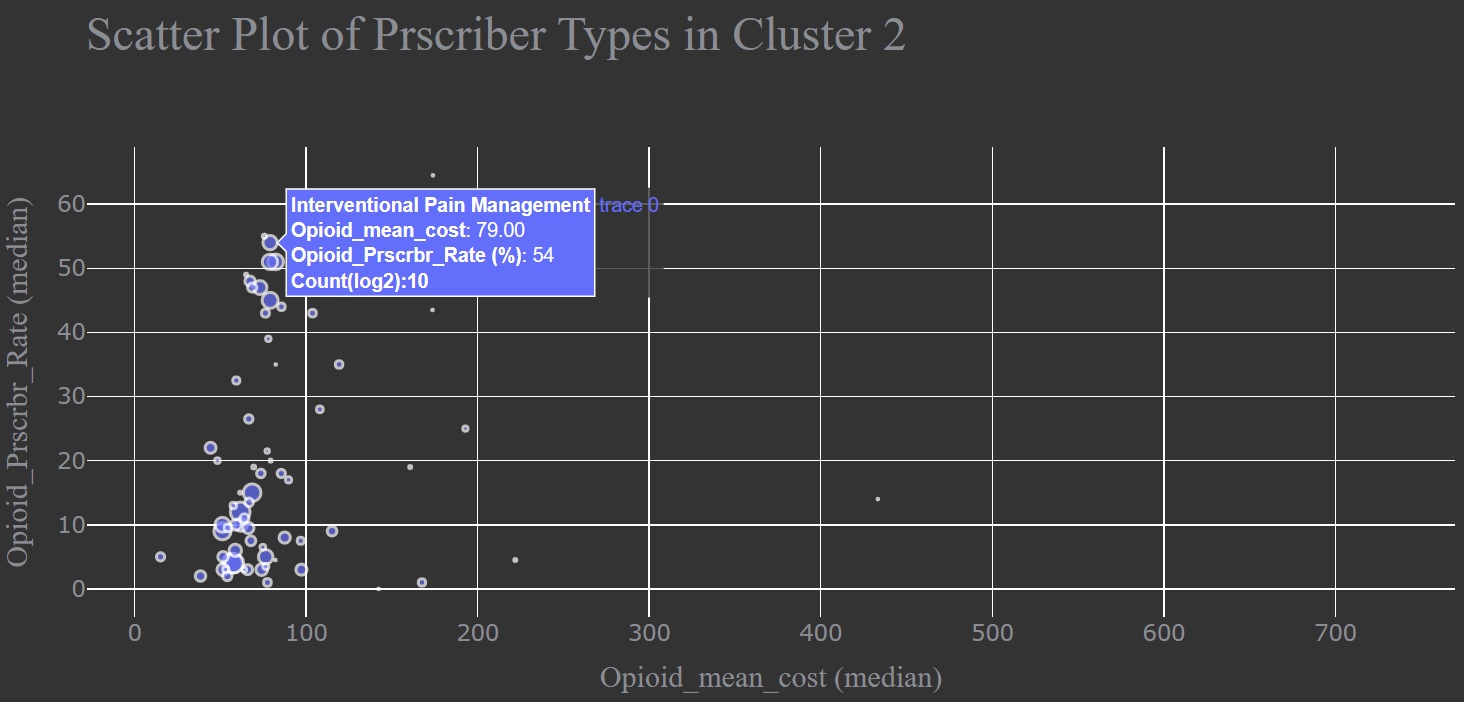
We taged cluster label into cleaned data, selected claims data belonging to cluster 2, then groupby specialty type, abtain the number of providers, median values of mean cost and priscription rate of opioids, display all details into a scatter plot as shown in below. we can see that opioid claim details by each specialty type on hovering over a circle. The specialty towards the upper right are the ones who offer opioid with high costs and priscription rate, and the circle size means the log2 number of providers in this specialty.
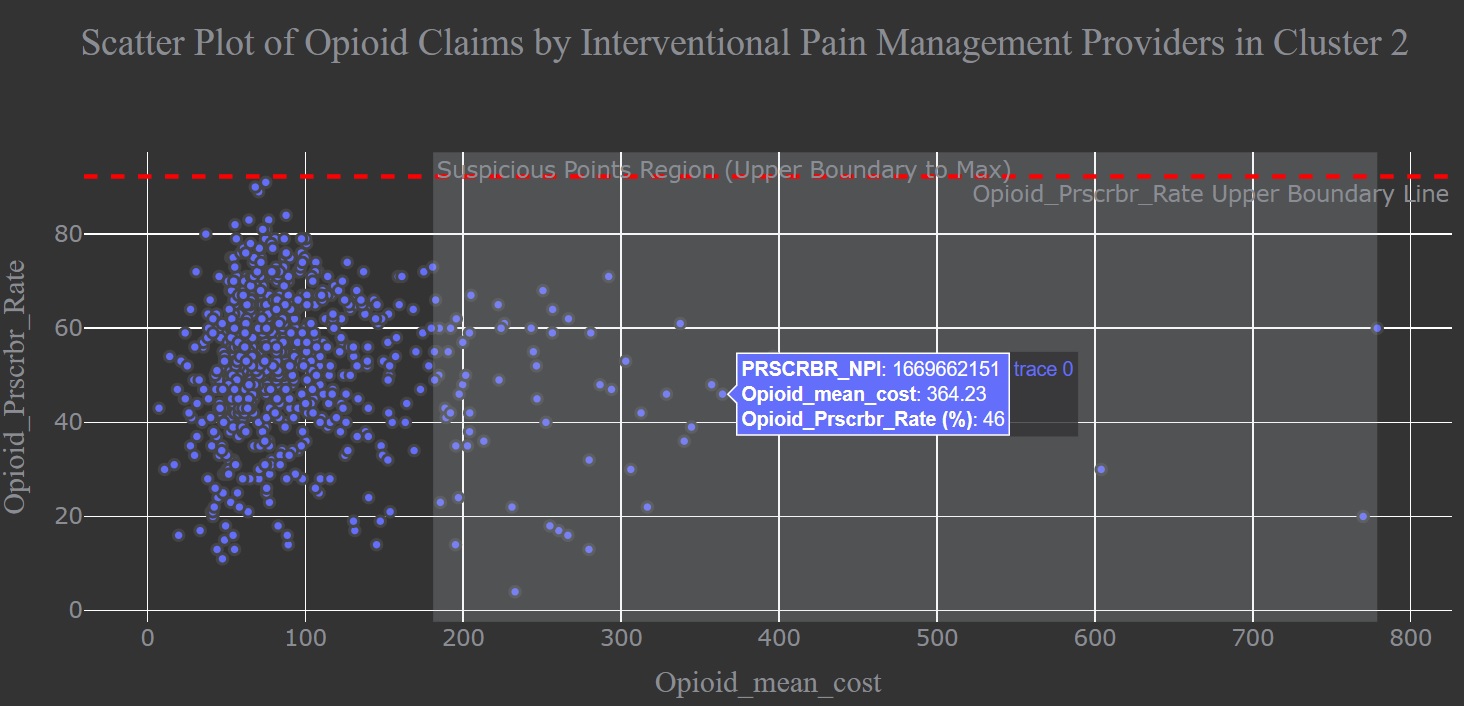
I dived deeper into claim information from Interventional Pain Management providers in cluster 2 to detect anomalous ones among this specalty type. Here, I used upper boundary line to seperate outliners from normal data. Any claim located in the suspicious data region is anomaly data. we can see that anomalous claim details by each provider on hovering over a circle.
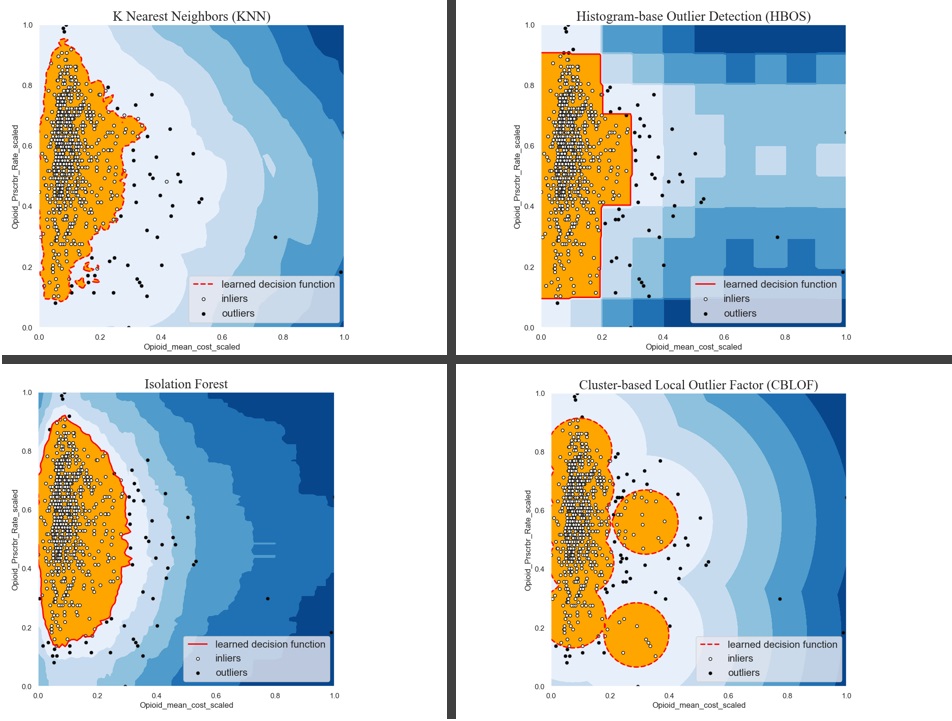
Method 2: Unsupervised Anomaly Detection
We also can use unsupervised anomaly detection methods to identify abnormal or unusual observations. The following graph display a comparison of the outlier detection algorithms, including K Nearest Neighbors (KNN), Histogram-base Outlier Detection (HBOS), Isolation Forest, Cluster-based Local Outlier Factor (CBLOF).
Choosing one of anomaly detection methods from above, we obtained a list of fraudulent prescribers.
df_ipm['outlier'] = y_pred_IForest.tolist()
Opioid_imp_1 = df_ipm.loc[df_ipm['outlier'] == 1]
print('List Providers (NPI) in Interventional Pain Management who offered anomaly opioid drugs on the claim:\n',
      list(Opioid_imp_1.PRSCRBR_NPI))
List Providers (NPI) in Interventional Pain Management who offered anomaly opioid drugs on the claim:
[1003269242, 1013954130, 1043297856, 1043303886, 1093753899, 1124137088, 1134348014, 1154345585, 1215000468, 1245264621, 1245438597, 1255305124, 1306038674, 1316941305, 1336170216, 1336180314, 1336432038, 1346230612, 1346274792, 1376907774, 1417189812, 1447200761, 1457351322, 1457418386, 1457434268, 1477565208, 1518922657, 1548273501, 1558353078, 1558501320, 1568410900, 1568585081, 1568677300, 1619934858, 1619950375, 1639167091, 1669662151, 1679511638, 1679572994, 1689600041, 1699717181, 1730400193, 1750451258, 1780874446, 1801819206, 1821088451, 1831457357, 1891775961, 1891781753, 1902005721, 1912993478, 1932109170, 1932182763, 1942599253, 1992702039, 1992904528]By selecting speicaled providers NPI from original dataset, we obtain the detailed information of each interventional pain management provider with fraudulent behavior.
Opioid_imp = df.merge(Opioid_imp_1, how='inner',left_on='PRSCRBR_NPI', right_on='PRSCRBR_NPI')
print(Opioid_imp.shape)
Opioid_imp.head(2)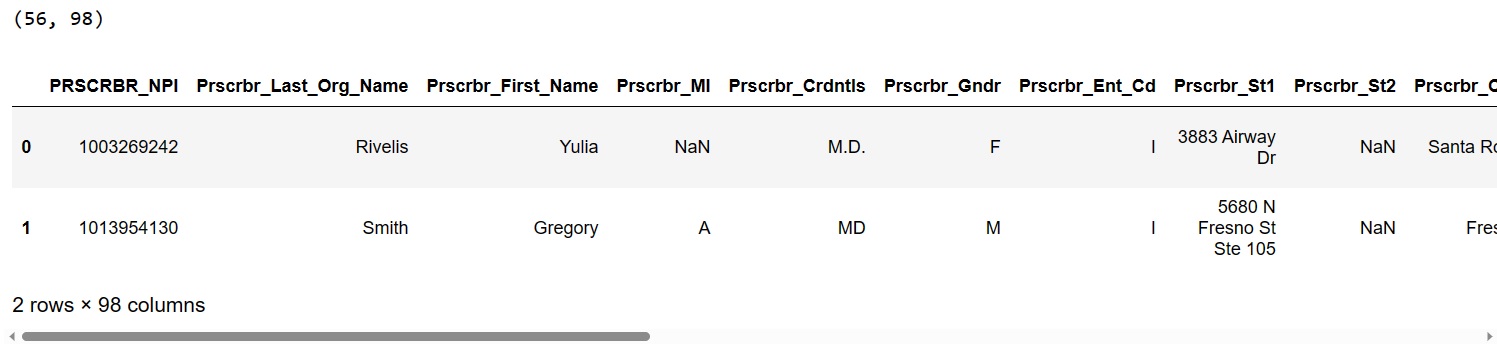
The souce code used to create this blog can be found in my github.